Tests - Art-ut-Kia/etherProbe GitHub Wiki
A first oscillogram
The following screenshot was obtained with the etherProbe mockup (the one assembled on a perfboard) connected to the TX line of the transmitting nucleo:
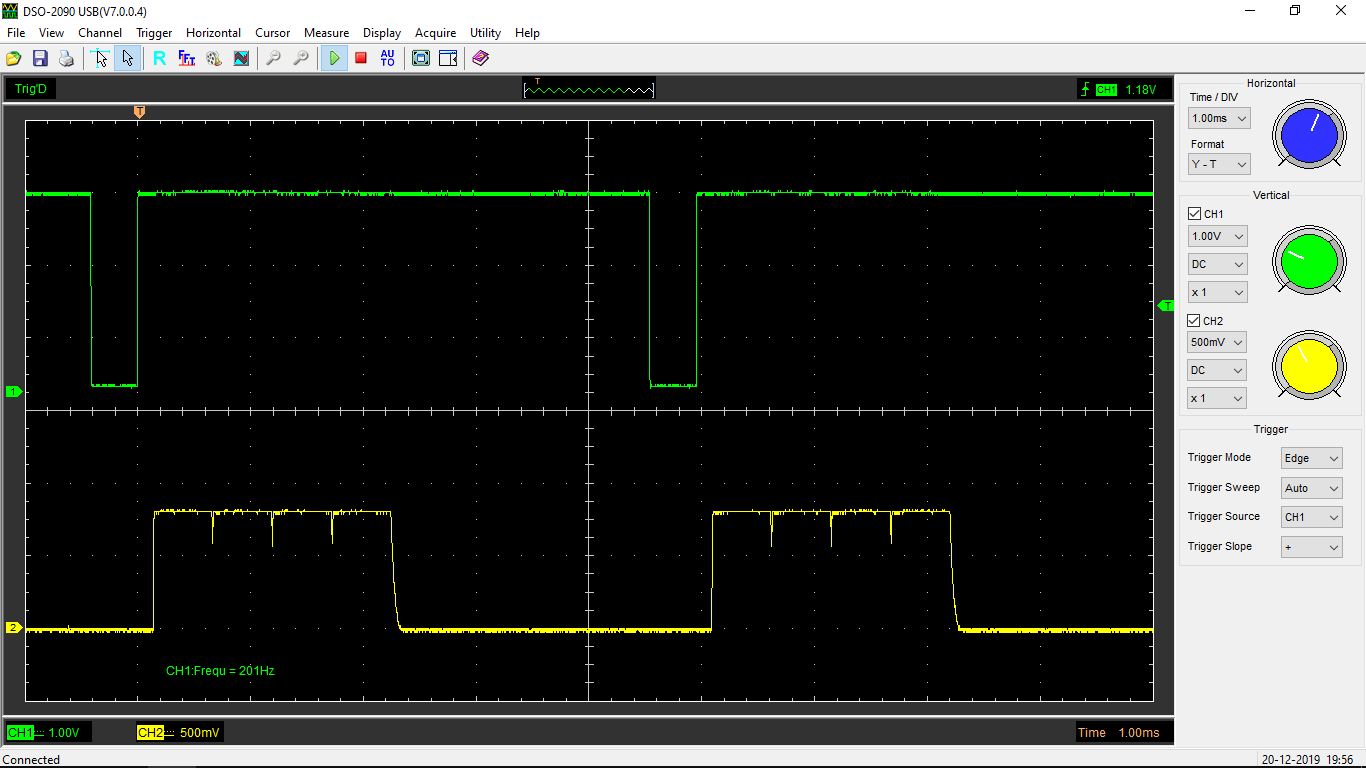
The upper curve (the green one, channel #1) is a 200Hz rectangular signal that is received by a first nucleo board to clock it. On each rising edge of this signal, the said first nucleo board updates a plant model and then transmits its state vector over Ethernet to 4 other nucleo boards (one UDP packet for each one).
The lower curve (yellow, channel #2) is the output of the etherProbe. One can clearly distinguish the 4 packets. Their duration is the expected one (about 6000 bits at 10Mbps = 0.6ms). However, during the interval between messages, it can be observed that the signal doesn't completely fall down to zero. This is due to the tradeoff made between the bandwidth and the sensitivity. The selected output resistor (220k) ensures a good sensitivity, but on the other hand, the time constant is a little bit greater than desired (more than a dozen of µs it seems). It shall also be noticed that there is no filtering capacitor, except the 10pF input capacitance of the oscilloscope probe.
But most of all, the lesson learnt from this project is that this probe is of no help when used on a fast Ethernet link. It has been tested at 100Mbps (the frequency of fast ethernet) and it works well. Unfortunately, only a continuous signal of about 600mV is observed. A deeper analysis of the documentation brings the explaination:
- during inter-message gaps, 1's are transmitted permanenly (bit stuffing)
- the MLT-3 modulation scheme translates each one into a transition. This results in the following sequence : 0, +1, 0, -1, 0, +1, ...
One can conclude that there is an uninterrupted RF activity on a 100BASE-T link, hence a probe that simple has no chance to show packets passing.
A more sophisticated tool, decoding MLT-3 modulation, would be required.