Chromosome theory, recombination, and mapping - AndersenLab/Genetic-Analysis GitHub Wiki


- ☿ - Virgin Female
- ⚥ - Hermaphrodite
- ♂ - Male
- ♀ - Female
- Non-disjunction is the failure of one or more pairs of homologous chromosomes or sister chromatids to separate normally during nuclear division, resulting in an abnormal distribution of chromosomes in the daughter nuclei.
Consider the following cross between a red-eyed (wild-type) male and a white-eyed female. Nearly all offspring are red-eyed regardless of sex. However, approximately 1/2000 offspring will be red-eyed males (Xw+Y) and white-eyed females (XwXw). How can this be?
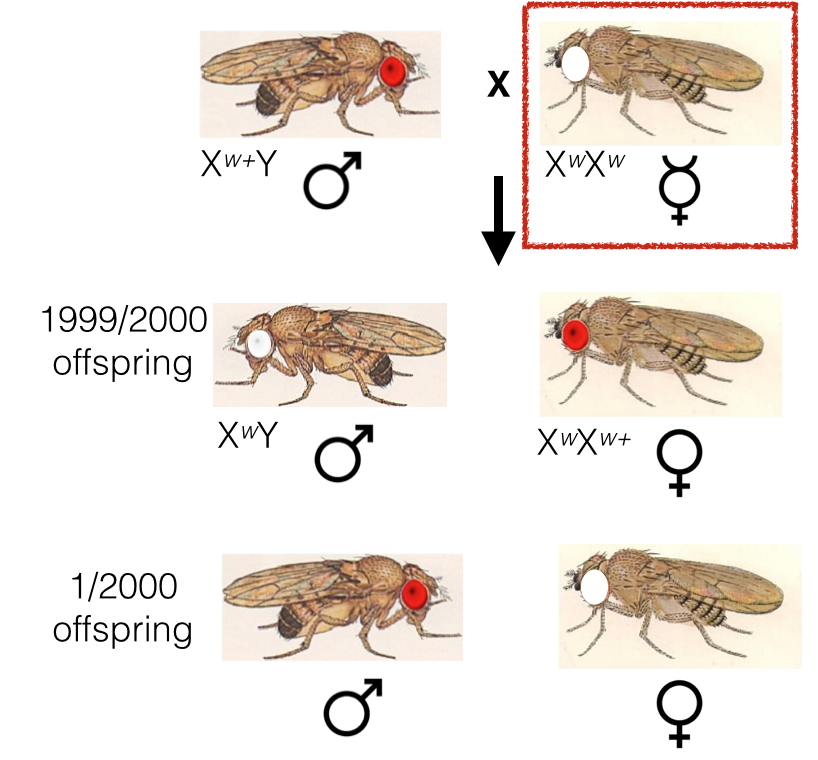
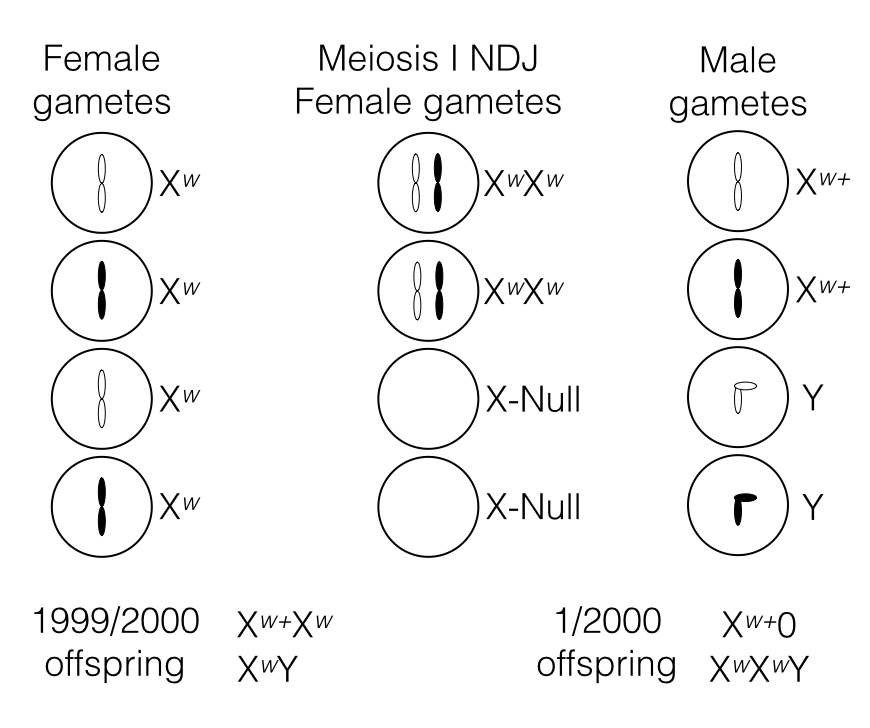
Red-eyed males and white-eyed females can result from non-disjunction occurring in meiosis I. These are the crosses that will produce these results:
- Xnull x Xw+ will produce red-eyed males.
- XwXw x Y will produce white-eyed females.
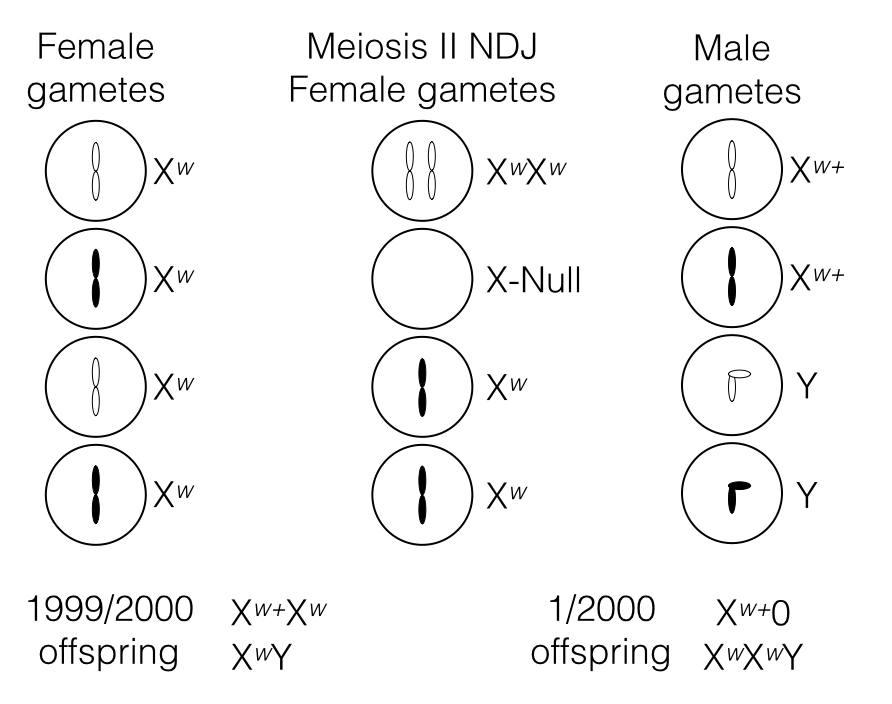
Non-disjunction occurring during meiosis II can also produce the unexpected red-eyed males and white-eyed females.
- Xnull x Xw+ will produce red-eyed males.
- XwXw x Y will produce white-eyed females.
Consider these questions:
-
Why did the XwY x Xw+Xw+ cross not indicate that non-disjunction was occurring?
-
How can you tell the difference between Meiosis I NDJ and Meiosis II NDJ?
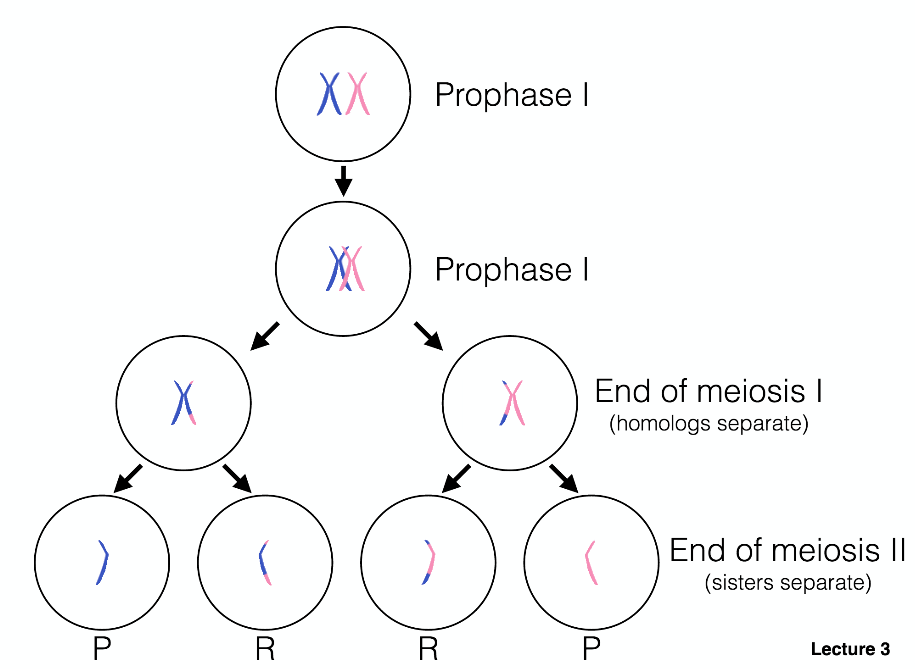
Recombination produces recombinant and parental chromosome products.
Genetic crosses can be used to determine genetic distance, which is measured in centimorgans. A centimorgan is the distance between two loci at which a recombination event is expected to occur at a frequency of 0.01 or 1%. Recombination frequencies can be used to map the genes that control traits, to determine distances of genes from each other, and to identify positions along a chromosome.
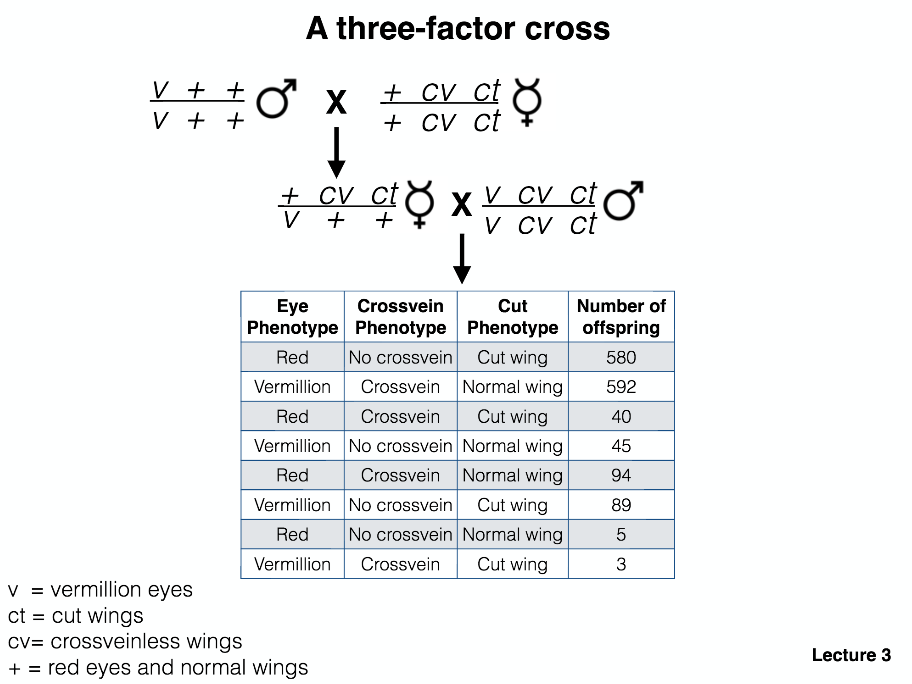
Steps to a three-factor cross mapping:
-
Determine the parental class of progeny (most prevalent class) and label.
-
Are all classes present? (If not, lethality or small numbers of measured offspring?)
-
If every class is present, label the least abundant class as the double recombinant. This step also tells you the gene that is in the middle!
-
Write out the genotypes of the offspring (with the correct gene in the middle).
-
Calculate the distance from one gene to middle gene.
Number of recombinants / Total progeny x 100 = cM distance between genes
- Calculate the distance from the other gene to the middle gene.
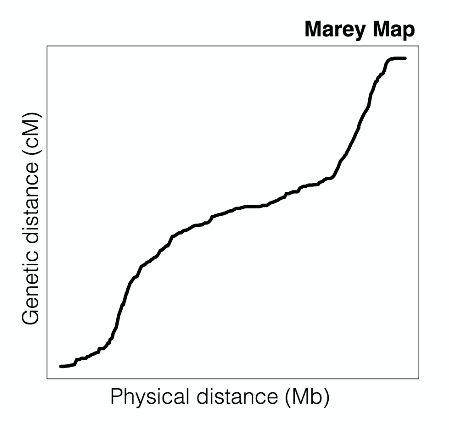
A Marey map is a plot used to visualize the relationship between recombination (centimorgan) frequency and physical position on a chromosome. The plot below illustrates the relationship in C. elegans.
- Non-disjunction I and II Video - Explanatory video of non-disjunction during meiosis I and II.
- Developing the Chromosome Theory
- Mitosis and Meiosis Guide - Good guide detailing how to count chromosomes and chromatids.
- Recombination and Mapping - Nature Guide
- Three Factor Cross Tutorial