Day 6 (9 19 2019): Data Categories and Visuals - Ajarlin/Data-Science GitHub Wiki
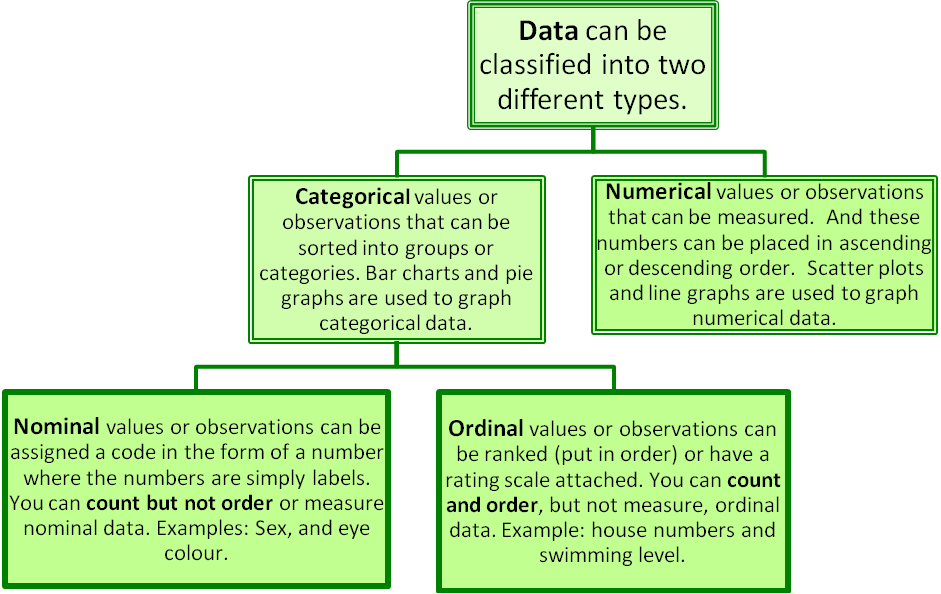
4 Major Data Type
-
Nominal: Categorical Data, No Ordering
Example- Pet: {Dog, Cat, Rabbit}
Operation : = ≠
-
Ordinal: Categorical Data, with Ordering
Example- Rating: {1,2,3,4,5}
Operation : = ≠, ≺, ≻, ≤, ≥
-
Interval: Numerical data, Zero has no fixed meaning
Example- Temperature, Fahrenheit
Operation : = ≠, ≺, ≻, ≤, ≥, +, -
-
Interval: Numerical data, Zero has special meaning
Example- Temperature, Kelvin(absolute Zero)
Operation : = ≠, ≺, ≻, ≤, ≥, +, -, ÷
Visualization Types
- 1D: bar chart, pie chart, histogram
- 2D: scatter plot, line plot, box and whisker plot, heatmap
- 3D+: Scatter matrix, bubble chart
Key Differentiation
Interval data. We care more about differences
Ratio data. We care more about ratios