Histogram - 3dct/open_iA GitHub Wiki
Up to Core widgets.
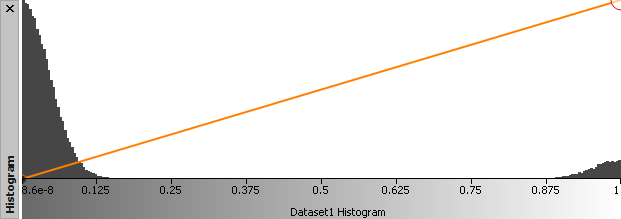
The histogram displays the distribution of intensities in a volume dataset:
For each dataset currently in the Dataset list, a histogram view is available. The name of the dataset is also shown in the x axis caption of the histogram. The number of bins used for the histogram (see notes below) can be changed in the dataset parameters available via the dataset list. The transfer function used for displaying the dataset is overlaid over the histogram. The transfer function specifies to which color and transparency value each of the intensity values is mapped. Color is specified by the points; the opacity is specified by the height of a point (the lower it is on the y-Axis, the more transparent, the higher, the more opaque). In between points, colors and opacity are interpolated linearly.
Possible interactions in the histogram:
- Zooming in the histogram works via the mouse wheel:
- Turning the mouse wheel without any keys pressed zooms along the X axis.
- When you hold the Alt key while turning the wheel, the chart zooms along the Y axis.
- When zoomed in, you can pan (i.e. move the histogram content sideways) by pressing the "Shift" key and dragging with the mouse
- Mouse clicks and drags without any modifier keys change the transfer function. Click anywhere in the chart to add a new point, you will be prompted for a color for it. Select a point by clicking on it (the selected point is displayed with an enlarged radius). To change the color of an existing point, either double-click on it, or select and choose "Change color" from the context menu. Move points higher or lower to change their opacity.
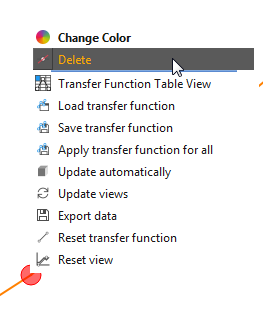
- In addition, there is a context menu available on right click, through which you can access additional functionality such as deleting a point, or saving and loading as well as copying and pasting the transfer function:
images/histogram-contextmenu.png
Number of histogram bins
The desired number of histogram bins can be changed through the dataset parameters, as remarked above. The default is 4096 bins; for smaller datasets and for datasets consisting of integer numbers, additional constraints are applied to make the histogram more useful:
- $2 * \sqrt{n}$ (with $n$ the number of voxels in the image) is the upper limit for the number of bins, in order to avoid "spiky" histograms for datasets with a lower number of voxels
- for datasets with integer data types, another restriction comes from the number of different data values. The number of bins is optimized such that the size of a single bin (the "step size") is an integer number, so that all bins contain an equal amount of data values. Some examples: a binary image with only the values 0 and 1 will only ever get 2 histogram bins; an image with integer values from 0..6000 will, if 4096 bins are requested, only get 3000 bins (the next smaller number that leads to an integer step size - 2 in this case).