Plotting multiple orbits: use cases - poliastro/poliastro GitHub Wiki
Note: This was implemented in https://github.com/poliastro/poliastro/pull/230
Introduction
There are concerns about what to do when plotting several orbits, see https://github.com/poliastro/poliastro/issues/205. Multiple use cases might arise, and we should understand them all.
1. Plot a single orbit
This use case is displayed in the documentation:
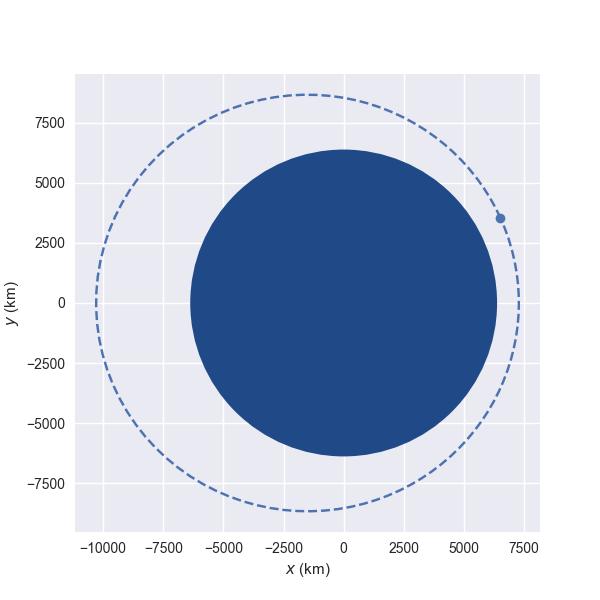
Nothing to do here.
2. Plot a sequence of states and maneuvers
This use case is displayed in the documentation:
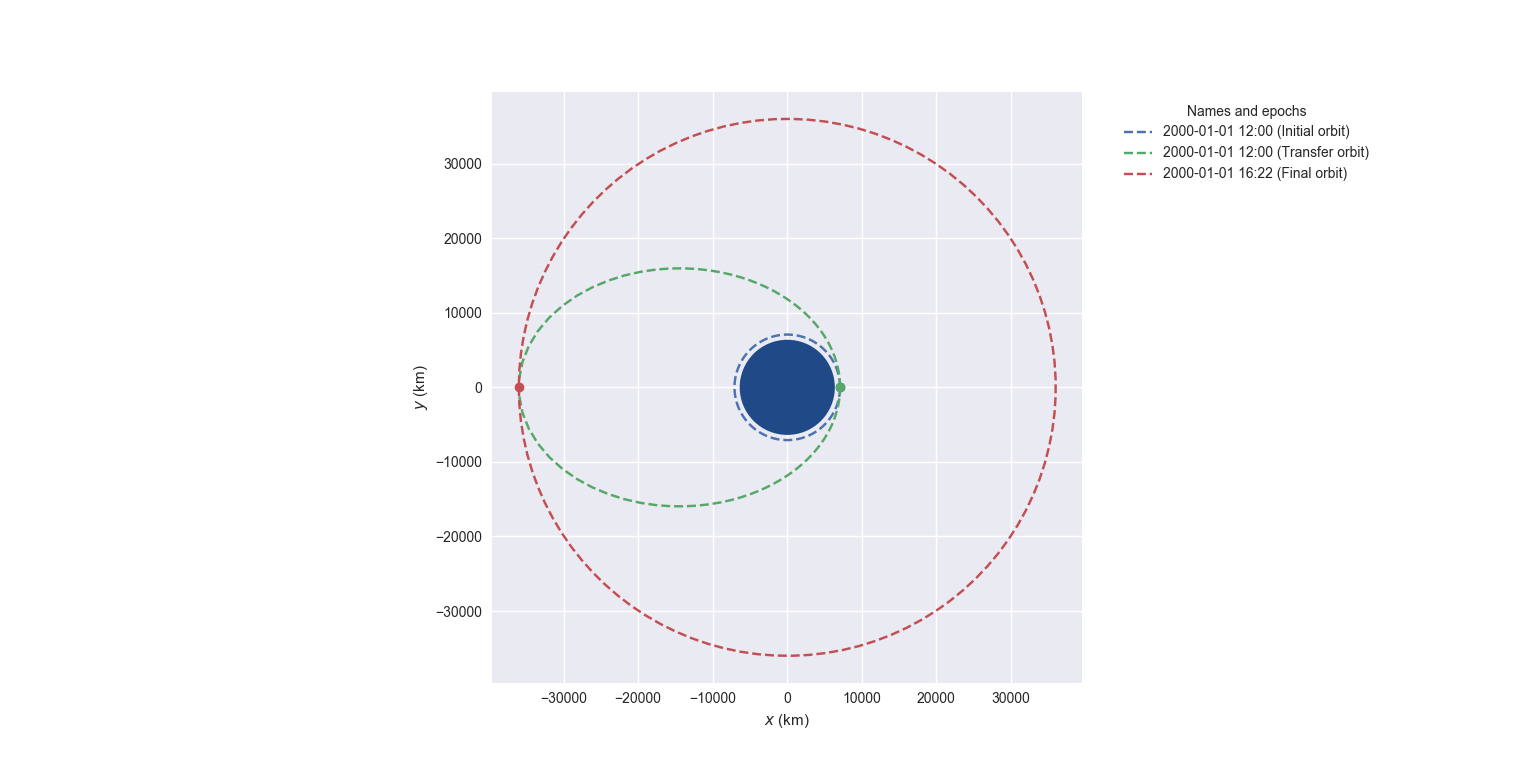
http://docs.poliastro.space/en/latest/user_guide.html#more-advanced-plotting-orbitplotter-objects
In this case we do not care much about the position, only about the arcs. It would be nice to have the initial and final epochs in the plot, or even the epoch of each maneuver. Right now only the last epoch is showed in the title.
3. Plot unrelated orbits to see their geometric distribution
For instance, plotting a bunch of asteroids to display the orbits. We are not interested in the positions. In this case, therefore, we do not care about the epoch.
4. Plot unrelated bodies to see their possible interaction
This use case appears in this issue:

https://github.com/poliastro/poliastro/issues/205
In this case, we are indeed interesting in the relative position of the bodies with respect to each other, rather than only their orbits. Right now only the last epoch is showed in the title, but we do not know which body we plotted last. This use case requires fixing.
Proposal
Raising a warning (as suggested here) would be annoying because there are valid use cases where the user might want to plot orbits in different epochs, as shown above. However, it's true that having the epoch in the title can be confusing.
Perhaps instead of propagating inside the OrbitPlotter, we can command the user to propagate from the outside. For it to be even cleaner, this would requires a propagate method that accepts a specific time, rather than a timedelta:
from poliastro.neos import dastcom5
from poliastro.plotting import OrbitPlotter

eros = dastcom5.orbit_from_name('eros')[0]
apophis = dastcom5.orbit_from_name('apophis')[0]

eros.epoch  # <Time object: scale='utc' format='jd' value=2451960.5>
apophis.epoch  # <Time object: scale='utc' format='jd' value=2454441.5>

frame = OrbitPlotter()
frame.plot(eros, label='eros')
frame.plot(apophis.propagate(eros.epoch), label='apophis')  # <-- Here
Ideas
- Remove epoch from title for more than one orbit
- Pros: Can be done regardless of the rest of options. Reduces confusion.
- Cons: The user might want this information in the plot, and it is all to them.
- Return more matplotlib data so the user can
annotateit.- Pros: Control to the user, less implementation burden.
- Cons: Requires careful documentation.
- Display epoch information in second legend http://matplotlib.org/users/legend_guide.html#multiple-legends-on-the-same-axes
- Pros: Simple, does not overwrite primary legend from the user (see case 2)
- Cons: Too much clutter inside the figure?
- Use interactive tooltips for extra information
- Pros: Effective, removes clutter.
- Cons: Requires interactivity, might not remove the need to do something for the static case.