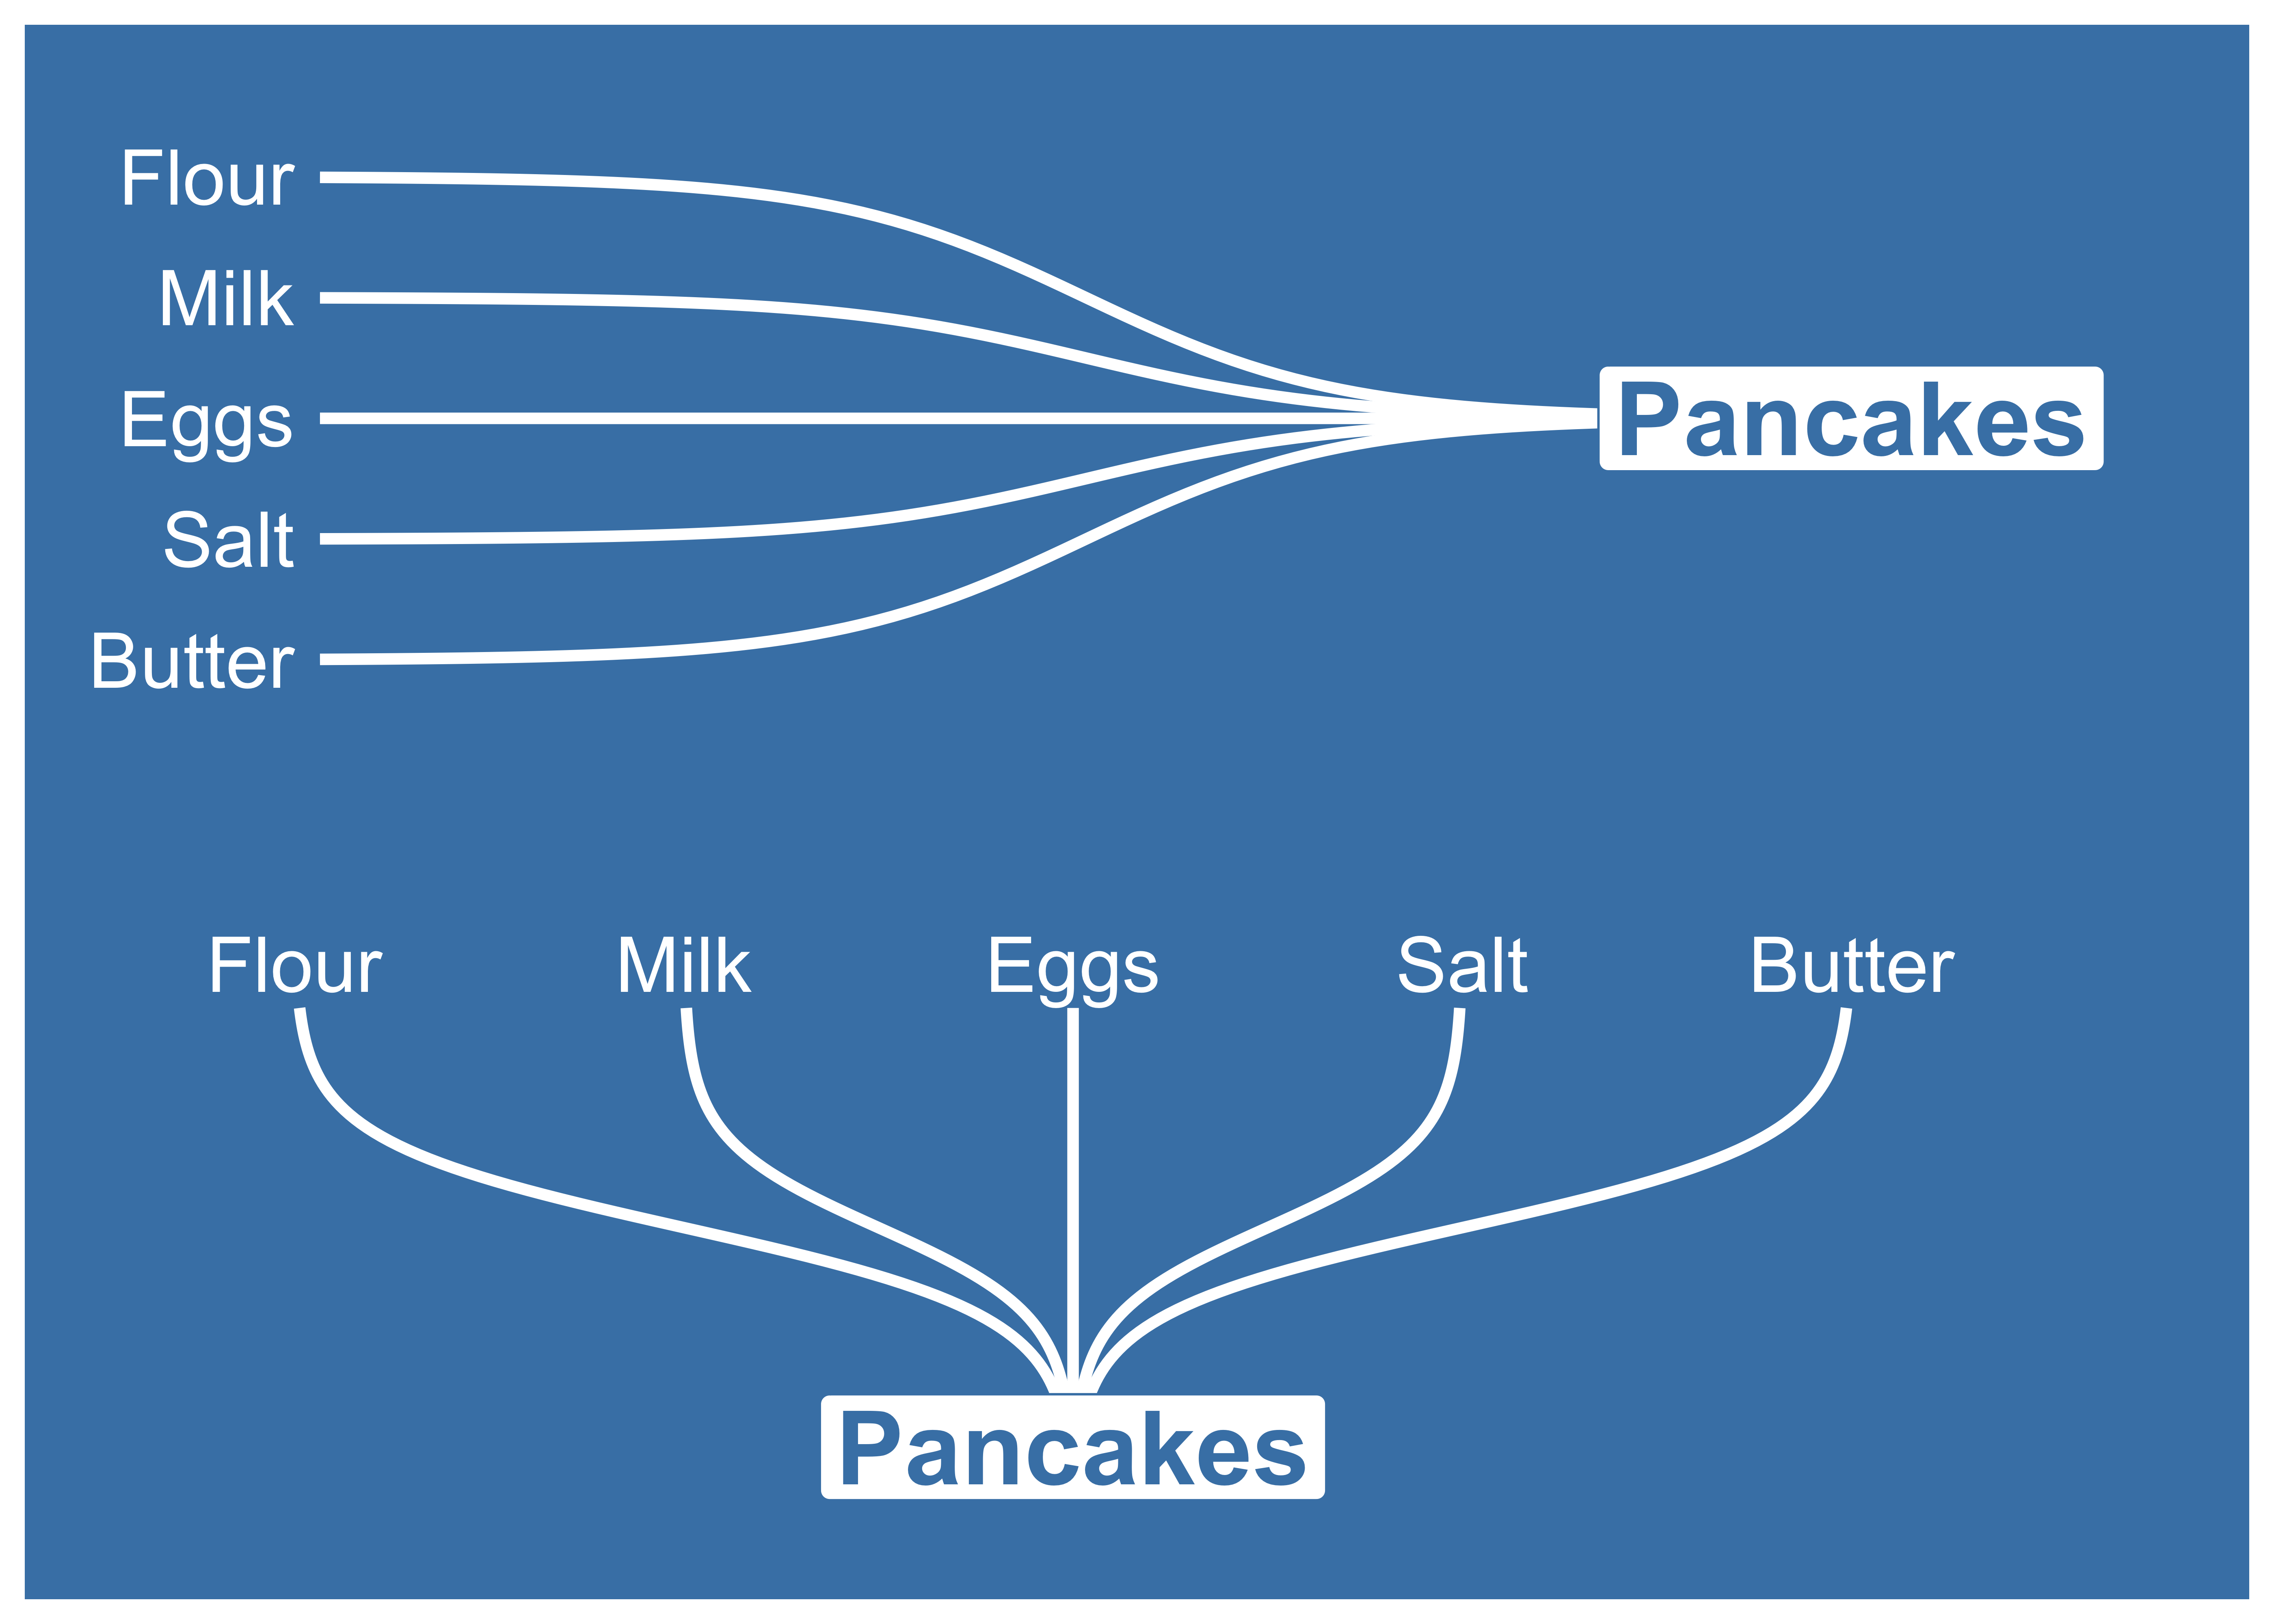
geom_sigmoid
ggbump also feature the custom sigmoid geom geom_sigmoid which lets
you specify exactly where each sigmoid curve should start and stop.
You will need to specify the aestethics x, y, xend, yend and
group. Below you’ll find an example:
pacman::p_load(tidyverse, hablar, ggbump, patchwork)

df <- tibble(
  yend = 1,
  y = 0,
  xend = 1:5,
  x = 3,
  group = c("Flour", "Milk", "Eggs", "Salt", "Butter")
)

df_x <- tibble(
  yend = 3,
  y = 1:5,
  xend = 3,
  x = 0,
  group = c("Flour", "Milk", "Eggs", "Salt", "Butter")
)

p1 <- ggplot(df_x) +
  geom_sigmoid(aes(x = x, y = y, xend = xend, yend = yend, group = factor(group)),
               direction = "x", color = "white", size = 1.2, smooth = 6) +
  geom_text(aes(x = x, y = y, label = group), size = 6, nudge_x = -.05, color = "white", hjust = 1) +
  geom_label(data = tibble(x = 3, y = 3, label = "Pancakes"),
             aes(x, y, label = label), inherit.aes = F, size = 8, color = "steelblue", fill = "white", fontface = "bold") +
  coord_cartesian(clip = "off") +
  scale_y_reverse() +
  theme_void() +
  theme(panel.background = element_rect(fill = "steelblue", color = "transparent"),
        plot.background = element_rect(fill = "steelblue", color = "transparent"),
        plot.margin = margin(1, 2.5, 1, 1.5, "cm"))

p2 <- ggplot(df) +
  geom_sigmoid(aes(x = x, y = y, xend = xend, yend = yend, group = factor(group)),
               direction = "y", color = "white", size = 1.2, smooth = 5) +
  geom_text(aes(x = xend, y = yend, label = group), size = 6, nudge_y = .1, color = "white") +
  geom_label(data = tibble(x = 3, y = 0, label = "Pancakes"),
             aes(x, y, label = label), inherit.aes = F, size = 8, color = "steelblue", fill = "white", fontface = "bold") +
  coord_cartesian(clip = "off") +
  theme_void() +
  theme(panel.background = element_rect(fill = "steelblue", color = "transparent"),
        plot.background = element_rect(fill = "steelblue", color = "transparent"),
        plot.margin = margin(1, 1, 1, 1, "cm"))

p1 / p2