Metrics about distribution of participation - aburillo/WikiChron GitHub Wiki
In order to evaluate the distribution of participation in a community, we have implemented a diverse group of metrics.
The metrics presented in this section are coefficients and ratios. They are represented as a monthly time series using the cumulative contributions until every given month from the birth of the wiki. In other words, for every month of the wiki, we take into account all the contributions made until that month to perform the computation of the metric.
You can see more about the assumptions and basic concepts regarding these metric computations, in the corresponding wiki page.
First, we resort to a general inequality metric. The Gini coefficient is a very common measure used to measure the inequality in a population, and in our case it is used to measure the participation inequality. It takes a real value from 0 to 1, being 0 a perfectly equal community (e.g. all community members perform the exact amount of contributions) and 1 an absolutely unequal community (e.g. one person assumes all the workload while the others do nothing). We have implemented the Gini coefficient with a correction factor for small data sets, following .
Let (n) be the number of contributors and (y_i) the contribution of individual (i), with ( y_i, i = 1 to n ), indexed in non-decreasing order ( (y_i \leq y_{i+1}) ) then:

Second, we aim to compare the participation from top contributors and the rest of the community. In order to do this, we have created a metric called Ratio 10:90, which calculates the quotient between the number of contributions from to the top 10% of contributors divided by the number contributions made by the other 90%. The ratio is 1 if the total contributions by the top contributors are equal to the contributions made by the rest; less than zero if the top 10% contributes less than the rest; and greater than 1 if the top top 10% contributes more than the other ninety percent, which is often the case in collaborative communities. Let (n) be the number of contributors and (x_i) the contribution of individual (i) with (i = 1,...,n) indexed in non-increasing order ( (x_i \geq x_{i+1}) ):
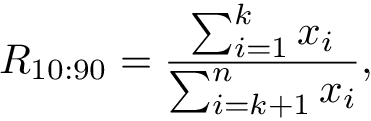
where ( k ) is ( \lceil 0.10 * n \rceil ).
We have implemented a series of ratios to show the relation within the top contributors of the wiki, so we can observe if the work is highly concentrated in a very small group of contributors or, conversely, it is more spread across a larger group. The tool provides different ratios to focus on different parts of the tail of top contributors and to better observe the evolution of its stratification. More precisely, the tool provides 3 ratios that calculate the quotient between the top 1st contributor, namely, the user who has made the largest number of edits, and other of the most active contributors. In particular, we make this calculation between the top 1st contributor and the contributor positioned at 5th, 10th and 20th percentile, from the list of contributors ordered in descending order of contribution size. Given the sorted list of contributors, the contributor at a given percentile, say 5th, has contributed less than the 5% of contributors that precede him or her, but more than the rest, i.e. the 95th percent of contributors after him or her.
Besides, the tool provides two additional similar ratios. One computes the quotient between the user in the position of the 5th percentile and the user in the 10th percentile. And the other computes the quotient between the 10th percentile user and 20th percentile user.
The higher the values of these metrics the longer the right tail of the participation distribution, i.e. the tail of the top contributors. It is expected to have high values of these metrics for communities with a long tailed distribution of participation between the core contributors, and low values within communities with a rather flat distribution between core users.
Let (n) be the number of contributors and (x_i), the contribution of individual (i), with (i = 1,...,n), indexed in non-increasing order ( (x_i \geq x_{i+1}) ):
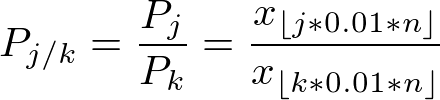
being j \in {1, 5, 10} the dividend percentile and k \in {5, 10, 20} the divider percentile, with j < k.