Road Network features in GeoDa
The Roads/Network features in GeoDa is under development of branch dev1.9_osm

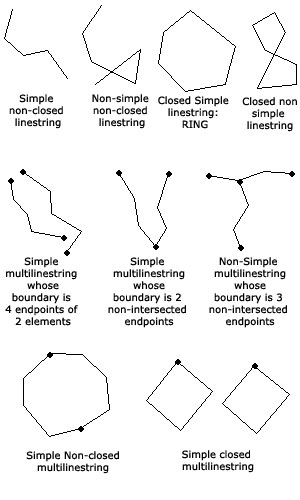
In this release (dev1.9_osm), the main purpose is to allow GeoDa to read/write, visualize and analyze road/network dataset. The Road/Network dataset is a collection of LineString or MultiLineString type spatial objects.
Please see ESRI doc for a definition of linestring and multilinestring
To load a road/network dataset, one just drag-n-drop related file to GeoDa. For example: one can drag and drop the Chicago_road.shp (Chicago’s road/network data downloaded from OpenStreetMap and in the format of ESRI shapefile, shown in the screenshot below) to GeoDa’s Connect to Datasource dialog.

Once you load the file in GeoDa, the roads/network will be rendered in a map window. With proper projection information (e.g. a .prj file), one can add a basemap layer (e.g. Carto light) and the road/network will be projected onto selected basemap layer.

All map operations (e.g. zoom, pan, select etc.), basic file operations (e.g. save, save-as, save-selected-as etc.), and table operations (e.g. spatial join, selection tool etc.) in GeoDa work on road/network data.
Exploratory analysis in GeoDa can be applied on road/network data with tabular data. GeoDa's brushing and linking provides an exploratory approach to analyze the road/network data. For example, one can create an unique value map using “highway” field in Chicago_road table data. Or, in the screenshot below, a percentile map is created using the "length" field in Manhattan’s roads dataset, and the roads with length <1% and 1%-10% are highlighted by shift-clicking on the legends <1% and 1%-10% on the left side of the map window.

Road/Network dataset can be added as a new layer in GeoDa for visualization and analysis purpose. For example, by click the “+” button on the toolbar in a map window, one can add a road/network dataset. GeoDa will automatically project the road/network to the working layer (the first map/dataset loaded in GeoDa) if the projections are different bewteen the layers.
A working layer is the first map or dataset you loaded in GeoDa. It is called working layer, because only the tabular data of working layer can be used to do exploratory data analysis and spatial regression in GeoDa. All other layers loaded later in GeoDa are used for visualization and spatial join only.

For spatial analysis, one can add a road data and an area(polygon) data in GeoDa. The polygon data added as a second layer can be used as a reference layer for visualization purpose. Moreover, by applying spatial join on the two layers, one can compute (1) how many roads are in each area (e.g. zip code area), and (2) which road belongs to which area(polygon). The first is called "spatial counting" and the second is called "spatial assigning".
1.2.1 Spatial Assigning
For example, with the Chicago_road.shp file loaded in GeoDa as a working layer, one can load the Chicago community boundary data (polygons) as a second layer. By using Table->Sptial Join, one can select the loaded boundary data and run spatial join to compute which road belongs to which community area in Chicago. The results will be saved as a new column in Chicago_road tabular data. The values in this column represent the id of community area in Chicago.

1.2.2 Spatial Counting
If the Chicago community boundary data is the working layer, and Chicago_road.shp file is loaded as a second layer. By using the same Table->Spatial Join feature, one can compute how many roads are within each community area. The results will be saved as a new column in Chicago community boundary data. The integer values in this column indicate the counting of roads in each community area.

At most time, the raw road/network datasets are fetched from OpenStreetMap or Tiger/lines. Those dataset may not fit perfectly into your research problem or are simply not aligned with your existing dataset. Using GeoDa, it becomes easy to visualize the raw road/network data. One can do simple query operations on road/network dataset in GeoDa to filter the raw dataset and save the query results to a new dataset for further analysis.
For example, one can select the "residential" type roads, or select the roads that only in certain communities. Then, use menu "File->Save Selected As", one can save selected roads into a new file.

Unlike creating weights using point/polygon dataset, when user clicks “Create” button in “Weights Manager”, there will be no "Weights Creating dialog". Instead, a message box will be popup to inform users that GeoDa will create weights using the basic topology of the roads/network. Click “Yes” button, a gal weights will be created.

Each road, which is either a linestring or multi-linestring, might consists of several line segments (see above figure of LineString/MultiLineString definition). When create a weights file, GeoDa will detect if two roads are connected or intersected via at least one shared vertex, which guarantees the accessibility of the two roads. If they are connected, GeoDa will treat these two roads as neighbors.
The accessibility is important when create spatial weights for roads/network data. In most road network data from OpenStreetMap, two roads might be very close but do NOT share any vertex(node). For example, as shown in the figure below, there are one east-bound highway segment (blue) and a west-bound (red) highway segment in a same area. In this case, the distance between the two roads can not be used to determine the neighborhood relationship. Another example is a bridge cross-over a perpendicular road underneath. The bridge intersects the underneath road visually, however they don't share a vertex at the cross location and therefore can not be treated as "neighbors".


This feature is a special version of “Spatial Join” with a case of computing how many points (events) occurred on each road. In detail, each point will be computed close to which road, and it will be snapped to a road it is close to, then counting how many points are “snapped” on each road. This is useful when analyze events, like car accidents, or crimes, that happen on roads.
For example, the "man_points.shp" dataset is a collection of car accidents happened in Manhattan city during a certain time period. In GeoDa, we can load the "man_roads.shp" dataset as working layer, and "man_points.shp" as a second layer. One can use "Menu->Tools->OpenStreetMap->Snap Points to Roads", to compute how many car accident events were on each road. The results are saved in a new column "SC". One can use this new column to create an "Equal Interval" map (see screenshot) to discover spatial patterns of the car accidents.

This will allow GeoDa users to download OSM road networks for a given area, and GeoDa can save the data into a ESRI shapefile that can be consumed by GeoDa and other GIS software. GeoDa uses OSM overpass api to fetch data. The implementation (fetching and parsing) is using C/C++, so it is faster than some python libraries. This feature will be helpful for users who don’t have road/network dataset in hands. We can extend more features like download administrative area data from OpenStreetMap.
For example, one can load their existing data (e.g. Chicago community boundary data), and then access “Menu->Tools->OpenStreetMap->Download OSM data”. In the popup dialog, the “Bounding box” in the popup dialog will be filled with values that extracted from current working layer. After click OK, GeoDa will prompt user to specify a file path to store the results. It takes less than one minute to download and save the roads in Chicago area in a shapefile.

With a road/network dataset loaded as a working layer, GeoDa can build a graph (or multi-graphs): the vertex and edges of the graph are extracted from the roads, and the distance of each edge is computed between two vertices (in the form of latitude and longitude) using arc distance (in meters) on earth surface. If road type (e.g. highway, motor_way, primary,secondary ..) and speed limitation information are stored in tabular data, GeoDa can further compute a travel time (in seconds) for each edge.
By using the Graph structure and the dijkstra shortest path algorithm, GeoDa can create a “travel heat map” on the fly. To create such a map, the geographical area of current working layer is first divided into small hexagons. One can specify the radius of hexagon in the configuration dialog of "Travel Heat Map". One can also specify other information like specify road type field, and speed limitation if they prefer a travel time instead of travel length.

GeoDa will compute a travel cost from every hexagon to a “start location” (where the green map marker is). The travel cost could be either the travel length (in meters) or travel time (in seconds). Different color will be assigned to hexagons with different travel cost. There are 10 different colors associated with 10 different categories of travel cost. The smaller travel cost with lighter color; the larger travel cost with darker color.

Default "start location" is at the center of the map, but one can change the "start location" by right click and choose “Set Start Location” to create different travel heat map on-the-fly. Left click on the map, one can see the shortest path computed by the Dijkstra shortest path algorithm from "start location" to the mouse position.

This is implemented to verify the Dijkstra shortest path algorithm used in “contracts” project to compute large distance matrix. It is also a useful tool to get a sense of the road/network and travel cost from different locations in an exploratory approach.

Normally, creating a travel distance matrix of a large dataset (e.g. 46k query points, and road/networks of 58,357 roads with 274,242 vertices) is time consuming. For example, on a latest iMacPro with 18 CPU cores, it took about 16 minutes to finish the task and generate a 8+GB binary file.
In GeoDa, by constructing an optimized graph structure, one can compute the travel distance matrix using the same dataset in about 4 minutes using a a MacPro with 12 CPU cores. Another experiment is using a regular laptop (MacBook with 4 CPU cores) to complete the same task in about 12 minutes. The performance is about 6x faster.
In GeoDa, it is also easy to compute a travel distance matrix. For example, one can load a road/network dataset (e.g. chicago_road.shp) as a working layer and a query points dataset (e.g. LEHD_blocks.csv) as a second layer. Then use "Table->OpenStreetMap->Compute Travel Distance Matrix" to access this feature. One can configure the "Speed Limit" information and specify field of "highway type", "max speed" and "one-way" in the tabular data of loaded road/network dataset. Click OK, user will be prompted to enter a file path to save the output travel distance matrix.

There is also a CPU+GPU hybrid solution for computing distance matrix implemented in GeoDa. The CPU part uses a ON(logN) Dijikstra algorithm, and the GPU part uses a O(N^2) algorithm due to a limitation of computational structure on GPU. Since the GPU algorithm is slower than the CPU algorithm, GeoDa suggest only use GPU+CPU solutions when you have more than 2 GPU cards, and GPU ratio of the task also needs to be tuned manually according to the number of your GPU devices and the performance of your GPU cards.
For example, with 2 GPU cards, the default GPU ratio is set to 0.2, which means the performance will be 20% faster ONLY IF GPUs can complete the 20% tasks as faster as CPU complete the 80% tasks; and you can increase the ratio if you have more GPU cards. This will benefit with a GPU server solution.

The output of the distance matrix is a simple binary file for testing purpose. HDF-5 will be used to read/write the distance matrix in next release. For reference, there is the structure of the binary file if you want to read it manually:
int (4bytes) number of query points (n_query)

char (1byte) '0' means no query ids, '1' means has query ids // currently only '0' is used, so just skip it

int (4bytes x n_query x n_query) the actual NxN distance matrix
A distance matrix for travel cost (e.g. time or distance) is often a large dense matrix. This distance matrix can be used as a weights matrix that GeoDa can consume for spatial data analysis. Because of the size of the matrix (e.g. in the example of Chicago above, the size of the matrix is about 8.7 Gb if saved in raw binary file on a hard disk), GeoDa will use HDF5 format for the storage of the distance matrix. Moreover, for compatibility purpose, the distance matrix will be structured using the generic weights format that GeoDa used.
Specifically, (1) only one distance matrix should be stored in one HDF5 file. (2) There will be NO HDF5 Group in this file. (3) The distance matrix will be stored in a HDF5 Dataset. (4)id variables will be stored in other HDF5 Datasets. (5) All metadata will be stored as HDF5 Attribute of the HDF5 File object. The figure below shows the data structure of HDF5 based distance matrix or spatial weights:
LEHD_DHEL.h5
(\ Root Group)
  |     |
  |     | (HDF5 Attributes)
  |     |-- dataset_name: DistMatrix //string, REQUIRED
  |     |-- rows: 256  // int, REQUIRED
  |     |-- columns: 128  // int, REQUIRED
  |     |-- is_symmetric: FALSE // bool/8bit enum(FALSE=0, TRUE=1), REQUIRED
  |      -- id_dataset_name: [LEHD_ids, DHEL_ids] // string array, OPTIONAL
  |
  |--DistMatrix (HDF5 dataset, Data Type: numeric, No. of Dimension: 2,
  |               Dimension Size: 256x128), REQUIRED
  |
  |--LEHD_ids (HDF5 dataset, Data Type: Int or String, No. of Dimension: 1,
  |           Dimension Size: 256), OPTIONAL
  |
   --DHEL_ids (HDF5 dataset, Data Type: Int or String, No. of Dimension: 1,
                 Dimension Size: 128), OPTIONAL
This data structure of HDF5 based distance matrix/spatial weights contains 2 major parts: (1) the meta-data stored as HDF5 Attributes, and (2) the distance matrix or id variables stored in HDF5 Datasets.
The meta-data of the distance matrix/spatial weights are stored as HDF5 Attributes of the HDF5 File Object. The attributes is a collection of key-value pairs, which are defined in the table below:
| Attribute Key Name | Attribute Value | Required? | Description |
|---|---|---|---|
| dataset_name | string | YES | The name of the HDF5 Dataset that stores distance matrix. This HDF5 Dataset could be a 2D matrix or 1D array (in case of storing a symmetric distance matrix) |
| rows | int | YES | The number of rows of the distance matrix |
| columns | int | YES | The number of columns of the distance matrix |
| is_symmetric | BOOL | YES | A flag to indicate the distance matrix is a symmetrical or asymmetrical matrix (see the definition of symmetric/asymmetric matrix below). |
| id_dataset_name | string array | NO | A string array to indicate the name(s) of HDF5 Dataset that stores id variables |
The definition of symmetric/asymmetric/square/non-square matrix is borrowed from linear algebra:
Square matrix is a matrix with the same number of rows and columns. Symmetric matrix is a square matrix that is equal to its transpose. Asymmetric matrix is a square matrix that at least some elements in the upper triangle are different from the corresponding elements in the lower triangle. Non-square matrix is a matrix with different number of rows and columns.
Based on different types of matrix, the distance matrix/spatial weights can be stored in HDF5 Dataset in 3 ways: (1) Symmetrical distance matrix (which current GeoDa spatial weights can fit in), (2) Asymmetrical distance matrix, and (3) Non-Square distance matrix. When read a HDF5 based distance matrix/spatial weights, the code logic could be
 attributes = read_attributes();
 if (attributes["is_symmetric"] == true) {
    process_symmetric_distance_matrix(); //origins == destination
 } else {
    if (attributes["rows"] == attributes["columns") {
       process_asymmetric_distance_matrix();
       // including 2 cases:
       // attributes["id_dataset_name"].length() == 1  origins == destinations
       // attributes["id_dataset_name"].length() == 2  origins != destinations
    } else {
       process_nonsquare_distance_matrix(); // origins != destinations
    }
}If the distance matrix is symmetrical, then the upper diagonal part of the matrix will be flattened and saved in a one-dimensional array HDF5 dataset. The size of the 1D array is N*(N-1)/2. When read this HDF5 file and the attribute is_symmetric is TRUE, one can assume that the origins and destinations are same. See the example below:
// 7.1 A symmetric matrix example: OD matrix, origins and destinations are same
// without id variable
LEHD_blocks.h5
(\ Root Group)
  |     |
  |     |-- dataset_name: LEHD_blocks
  |     |-- rows: 256
  |     |-- columns: 256
  |      -- is_symmetric: TRUE
  |
   --LEHD_blocks (HDF5 dataset, Data Type: numeric, No. of Dimension: 1,
                  Dimension Size: 256x(256-1)/2)
If there is an id variable associated with the origins/destinations, this id variable can be stored in another HDF5 Dataset and one can find the name of this dataset in attribute "id_dataset_name".
// 7.2 A symmetric matrix example: OD matrix, origins and destinations are same
// with one id variable attached
LEHD_blocks.h5
(\ Root Group)
  |     |
  |     |-- dataset_name: LEHD_blocks
  |     |-- rows: 256
  |     |-- columns: 256
  |     |-- is_symmetric: TRUE
  |      -- id_dataset_name: [ids]
  |
  |--LEHD_blocks (HDF5 dataset, Data Type: numeric, No. of Dimension: 1,
  |               Dimension Size: 256x(256-1)/2)
  |
   --ids (HDF5 dataset, Data Type: Int or String, No. of Dimension: 1,
          Dimension Size: 256)
In practice, there are two cases can generate asymmetrical distance matrix: (1) origins and destinations are same and one-way trips are considered, and (2) origins and destinations are different. In both cases, the origins and destinations have same size. The distance matrix will be stored as a 2D matrix in a HDF5 Dataset. See the two examples of case (1) below:
// 7.3 An asymmetric matrix example: OD matrix,
// origins and destinations are same
// without id variable
LEHD_blocks.h5
(\ Root Group)
  |     |
  |     |-- dataset_name: LEHD_blocks
  |     |-- rows: 256
  |     |-- columns: 256
  |      -- is_symmetric: FALSE
  |
   --LEHD_blocks (HDF5 dataset, Data Type: numeric, No. of Dimension: 2,
                  Dimension Size: 256x256)
If there is an id variable associated with the origins/destinations, this id variable can be stored in another HDF5 Dataset and one can find the name of this dataset in attribute "id_dataset_name".
// 7.4 An asymmetric matrix example: OD matrix,
// origins and destinations are same
// with one id variable attached
LEHD_blocks.h5
(\ Root Group)
  |     |
  |     |-- dataset_name: LEHD_blocks
  |     |-- rows: 256
  |     |-- columns: 256
  |     |-- is_symmetric: FALSE
  |      -- id_dataset_name: [ids]
  |
  |--LEHD_blocks (HDF5 dataset, Data Type: numeric, No. of Dimension: 2,
  |               Dimension Size: 256x256)
  |
   --ids (HDF5 dataset, Data Type: Int or String, No. of Dimension: 1,
          Dimension Size: 256)
For the case (2) when origins and destinations are different, two id variables (one for origins and one for destinations) should be stored in HDF5 Datasets with their names stored in HDF5 Attribute "id_dataset_name". See the example below:
// 7.5 An asymmetric matrix example: OD matrix,
// origins and destinations are different
// with two id variables attached
LEHD_DHEL.h5
(\ Root Group)
  |     |
  |     |-- dataset_name: DistMatrix
  |     |-- rows: 256
  |     |-- columns: 256
  |     |-- is_symmetric: FALSE
  |      -- id_dataset_name: [LEHD_ids, DHEL_ids]
  |
  |--DistMatrix (HDF5 dataset, Data Type: numeric, No. of Dimension: 2,
  |               Dimension Size: 256x256)
  |
  |--LEHD_ids (HDF5 dataset, Data Type: Int or String, No. of Dimension: 1,
  |           Dimension Size: 256)
  |
   --DHEL_ids (HDF5 dataset, Data Type: Int or String, No. of Dimension: 1,
                 Dimension Size: 256)
If the distance matrix is non-square, that means the number of rows is different than the number of columns. For example, when compute travel distance matrix, the origins and destinations (and their sizes) are different. In this case, the distance matrix will be stored as a 2D matrix in HDF5 Dataset, and the id variables for origins and destinations will be stored in two other HDF5 Datasets with their names stored in HDF5 Attribute "id_dataset_name". See the example below:
// 7.6 An non-square matrix example: OD matrix,
// origins and destinations are different
// with two id variables attached
LEHD_DHEL.h5
(\ Root Group)
  |     |
  |     |-- dataset_name: DistMatrix
  |     |-- rows: 256
  |     |-- columns: 128
  |     |-- is_symmetric: FALSE
  |      -- id_dataset_name: [LEHD_ids, DHEL_ids]
  |
  |--DistMatrix (HDF5 dataset, Data Type: numeric, No. of Dimension: 2,
  |               Dimension Size: 256x128)
  |
  |--LEHD_ids (HDF5 dataset, Data Type: Int or String, No. of Dimension: 1,
  |           Dimension Size: 256)
  |
   --DHEL_ids (HDF5 dataset, Data Type: Int or String, No. of Dimension: 1,
                 Dimension Size: 128)
Other parameters when create a HDF5 distance matrix:
Normally, HDF5 uses row-major ordering and multi-dimensional data is flattened to disk. Therefore, it will be faster if you access the data by rows or blocks of rows. In case of a multi-threaded reading of HDF5 dataset, if you plan to process the matrix by small chunks (e.g. 1000 x 1000) parallel, the flattened matrix will not be ideal . Use HDF5, you can setup the chunk size (e.g. 1000x1000) when you create a HDF5 dataset, so that the storage on disk will be optimized by the chunk size you specified to boost the reading performance.
A number of compression filters are available in HDF5. Here is a table of the compression performance of 1024,000 random float data. By far the most commonly used is the GZIP (or DEFLATE) filter.
| Compressor | Compression time (ms) | Decompression time (ms) | Compressed by |
|---|---|---|---|
| None | 9.0 | 7.8 | 0.0% |
| LZF | 67.8 | 24.9 | 8.95% |
| GZIP | 305.4 | 67.2 | 17.05% |
| SZIP | 120.6 | 107.7 | 15.56% |
GeoDa supports two different weights format: GAL and GWT/KWT. Both GAL and GWT/KWT are ASCII based file format, which are not designed for storage efficiency. There are some other formats can handle large dataset. For example, ESRI has a binary format (.SWM) for spatial weights. In Matlab community, spatial weights are stored as a 2D matrix using Matlab's .mat file. Since version 7.3, the .mat-file uses an HDF5 base format.
HDF-5 format for distance matrix can be used as a replacement for GAL or GWT/KWT weights when the file size is too large to handle. In GeoDa, the weights (in-memory) can be represented using a sparse matrix. Then, save this sparse matrix in HDF5 format with compression filters by following the specification described in this section. It is worth to note that, since the spatial weights (e.g. queen/rook, or distance based) created in GeoDa are very sparse, the compression filters has to be used when create a HDF5 based spatial weights for a better storage efficiency.
Some test results of HDF5:
writing test: ~18 seconds for 8.56GB HDF5 file without compression.
reading test: ~4.4 seconds for 8.56GB HDF5 file without compression.